Religion and Data: A Presentation for the American Academy of Religion 2016
On November 19th I had the opportunity to be part of the Digital Futures of Religious Studies panel at the American Academy of Religion in lovely San Antonio, Texas. It was wonderful to see the range of digital work being done in the study of religion represented and to participate in making the case for that work to be supported by the academy.
Panel members represented a wide range of digital work, from large funded projects to digital pedagogy. I focused my five minute slot on the question of data and the need to recognize the work of data creation and management as part of the scholarly production of digital projects.
tl;dr: I argued in my presentation that as we create scholarly works that rely on data in their analysis and presentation, we also need to include the production, management, and interpretation of data in our systems for the assessment and evaluation of scholarship.
What is involved when working with data? And how do we evaluate scholarship that includes data-rich analyses? These are the two questions that I want to bring up in my 5 minutes.
My dissertation sits in the intersection of American religious history and the digital humanities.
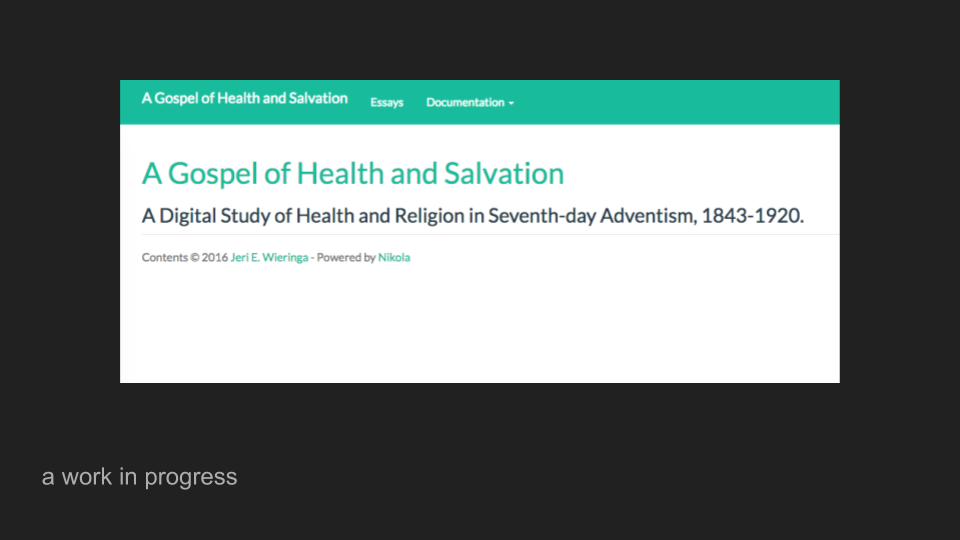
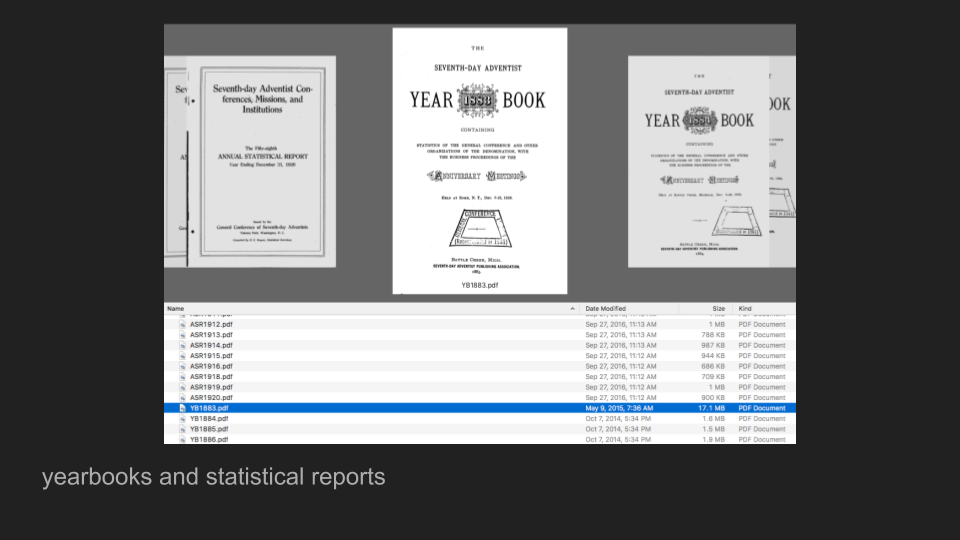
I am studying the development of Seventh-day Adventism and the interconnections between their theology and their embrace of health reform. To explore these themes, I am using two main groups of sources: published periodicals of the denomination and the church yearbooks and statistical records, supplemented by archival materials.
In recent years the Seventh-day Adventist church has been undertaking an impressive effort to make their past easily available.
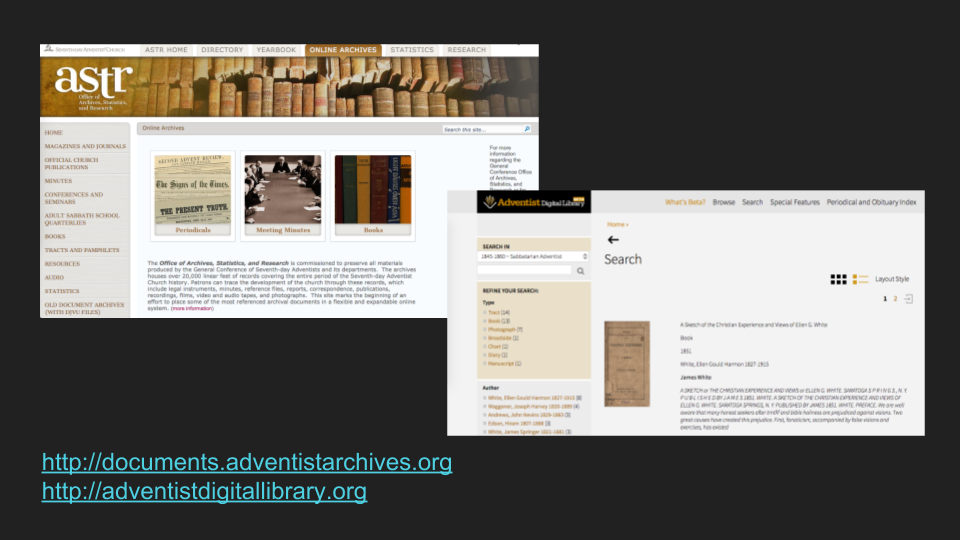
Many of the official publications and records are available at the denominational site (http://documents.adventistarchives.org/) and a growing collection of primary materials are being release at the new Adventist Digital Library (http://adventistdigitallibrary.org/).
This abundance of digital resources makes it possible to bring together the computational methods of the digital humanities with historical modes of inquiry to ask broad questions about the development of the denomination and the ways American discourses about health and religious salvation are inter-related.
But … one of the problems of working with data is that while it is easy to present data as clean and authoritative, data are incredibly messy and it is very easy to “do data” poorly.
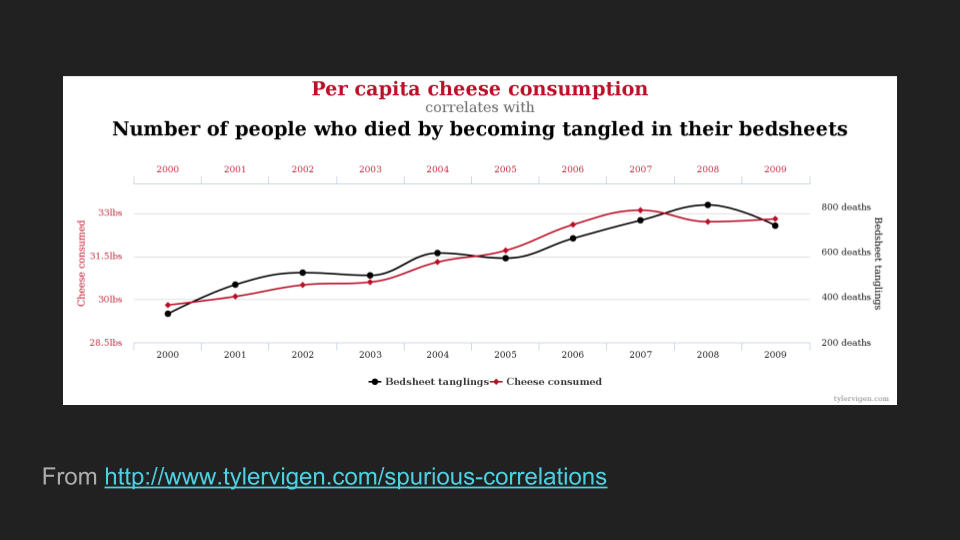
Just google “how to lie with statistics” (or charts, or visualizations). It happens all the time and it’s really easy to do, intentionally or not. And that is when data sets are ready for analysis.
Most data are not; even “born digital” data are messy and must be “cleaned” before they can be put to use. And when we are dealing with information compiled before computers, things get even more complicated.
Let me give you an example from my dissertation work.
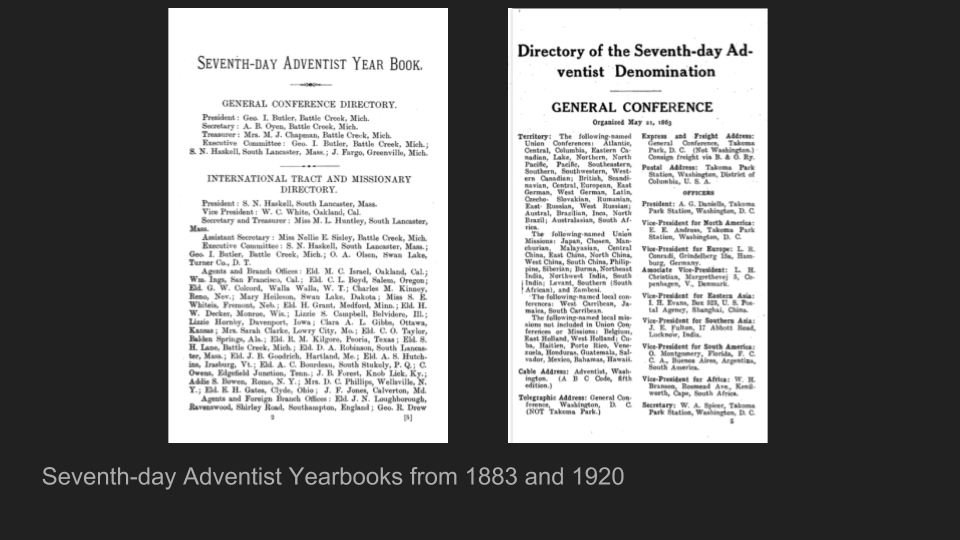
This first page was published in 1883, the first year the denomination dedicated a publication to “such portions of the proceedings of the General Conference, and such other matters, as the Committee may think best to insert therein.” The second is from 1920, the last year in my study.
You can begin to see how this gets complicated quickly. In 1883, the only data recorded for the General Conference was office holders (President, VP, etc.) and we go straight into one of the denominational organizations. In 1920, we have a whole column of contextual information on the scope of the denomination, a whole swath of new vice-presidents for the different regions, and so forth.
What happened over those 40 years? The denomination grew, rapidly, and the organization of the denomination matured; new regions were formed, split, and re-formed; the complexity of the bureaucracy increased; and the types of positions available and methods of record keeping changed.
Adding to that complexity of development over time, the information was entered inconsistently, both within a year and across multiple years. For example, George Butler, who was a major figure in the early SDA church, appears in the yearsbooks as: G.I. Butler; George I. Butler, Geo. I. Butler; Elder Geo. I. Butler …. it keeps going.
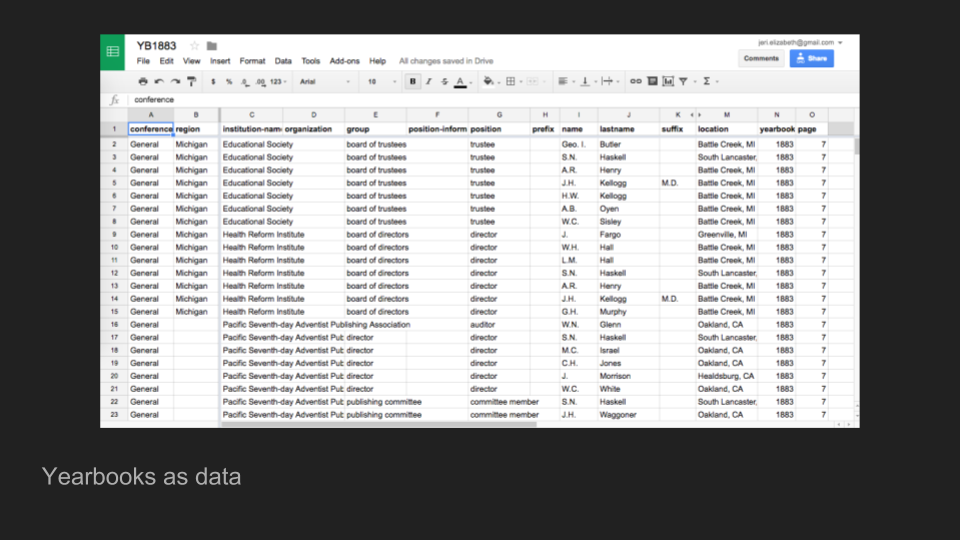
Now what I want is data that looks like this, because I am interested in tracking who is recorded as having leadership positions within the denomination and how that changes over time. But this requires work disambiguating names, addressing changing job titles over time, and deciding which pieces of information, from the abundance of the yearbooks, are useful to my study.
All of that results in having to make numerous interpretive decisions when working to translate this information into something I can work with computationally.
There are many ways to do this, some of which are better than others. My approach has been to use the data from 1920 to set my categories and project backwards. For example, in 1883 there were no regional conferences, so I made the decision to restricted the data I translated to the states that will eventually make up my four regions of study. That is an interpretive choice, and one that places constraints around my use of the data and the posibilities for reusing the data in other research contexts. These are choices that must be documented and explained.
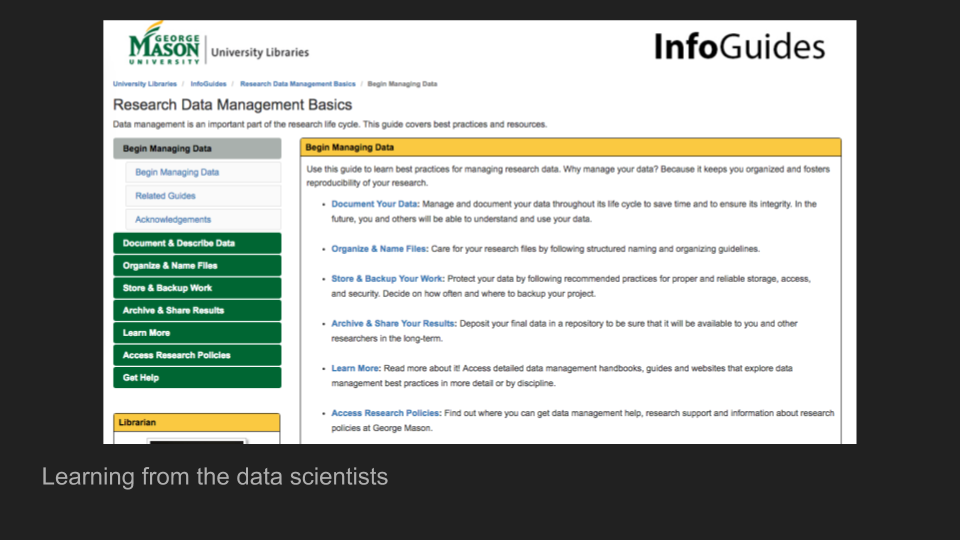
Fortunately, we are not the first to discover that data are messy and complicated to work with. There are many existing practices around data creation, management, and organization that we can draw on. Libraries are increasingly investing in data services and data management training, and I have greatly benefited from taking part in those conversations.
Working with data is a challenging, interpretive, and scholarly activity. While we may at times tell lies with our data and our visualizations, all scholarly interpretation is an abstraction, a selective focusing on elements to reveal something about the whole. What is important when working with data is to be transparent about the interpretive choices we are making along the way.
My hope is that as the use of data increases in the study of religion, we also create structures to recognize and evaluate the difficult intellectual work involved in the creation, management, and interpretation of that data.